Sales Summary & Analytics Guide
A comprehensive guide to viewing your sales history, analyzing performance, and understanding your token sales data on TradePoint.
1. Introduction
The Summary & Analytics page is your central hub for reviewing historical sales performance. It provides detailed tables, visual charts, and data export capabilities to help you understand how your automated token sales have performed over time.
What You Can Do
- View Sales History - See all executed sales with dates and amounts
- Analyze Performance - Track USDT rates and volumes over time
- Compare Periods - Switch between yearly, monthly, or custom date ranges
- Visualize Trends - View charts showing rate patterns
- Export Data - Download CSV files for external analysis
- Track Multiple Tokens - Switch between different tokens to compare performance
[!NOTE] The Summary page shows historical data from executed sales only. It does not show pending configurations or future sales targets.
2. What is the Summary Page?
Purpose
The Summary page answers questions like:
- How much have I sold over the past month?
- What USDT rates did I get for my sales?
- What’s the trend in my sales volume?
- How does this year compare to last year?
- When were my highest and lowest sales?
Data Source
The Summary page displays data from:
- ✅ Completed sales from your Sales Configurations
- ✅ Executed transactions processed by the platform
- ��✅ Historical records dating back to your first sale
The page does NOT show:
- ❌ Future sales (even if configured)
- ❌ Pending sales (not yet executed)
- ❌ Sales from other users (privacy protected)
Key Components
3. Accessing the Summary Page
Step 1: Navigate to Summary
- Log into your TradePoint account
- From the main navigation menu, click “Summary” or “Sales Summary”
- The Summary & Analytics page loads
Step 2: Select Your Token
When the page loads, you’ll see a “Select Token” dropdown at the top.
What You’ll See:
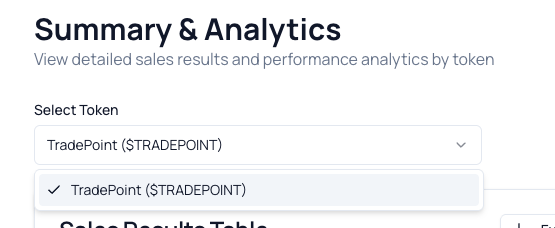
To Select a Token:
- Click the dropdown
- Browse available tokens
- Click on the token you want to view
What Happens:
- The page loads sales data for the selected token
- Both the table and chart update automatically
- Period selector shows available date ranges for this token
[!NOTE] Only tokens with sales history appear in the dropdown. If you configured sales but haven’t executed any yet, the token won’t show until the first sale completes.
4. Understanding the Interface
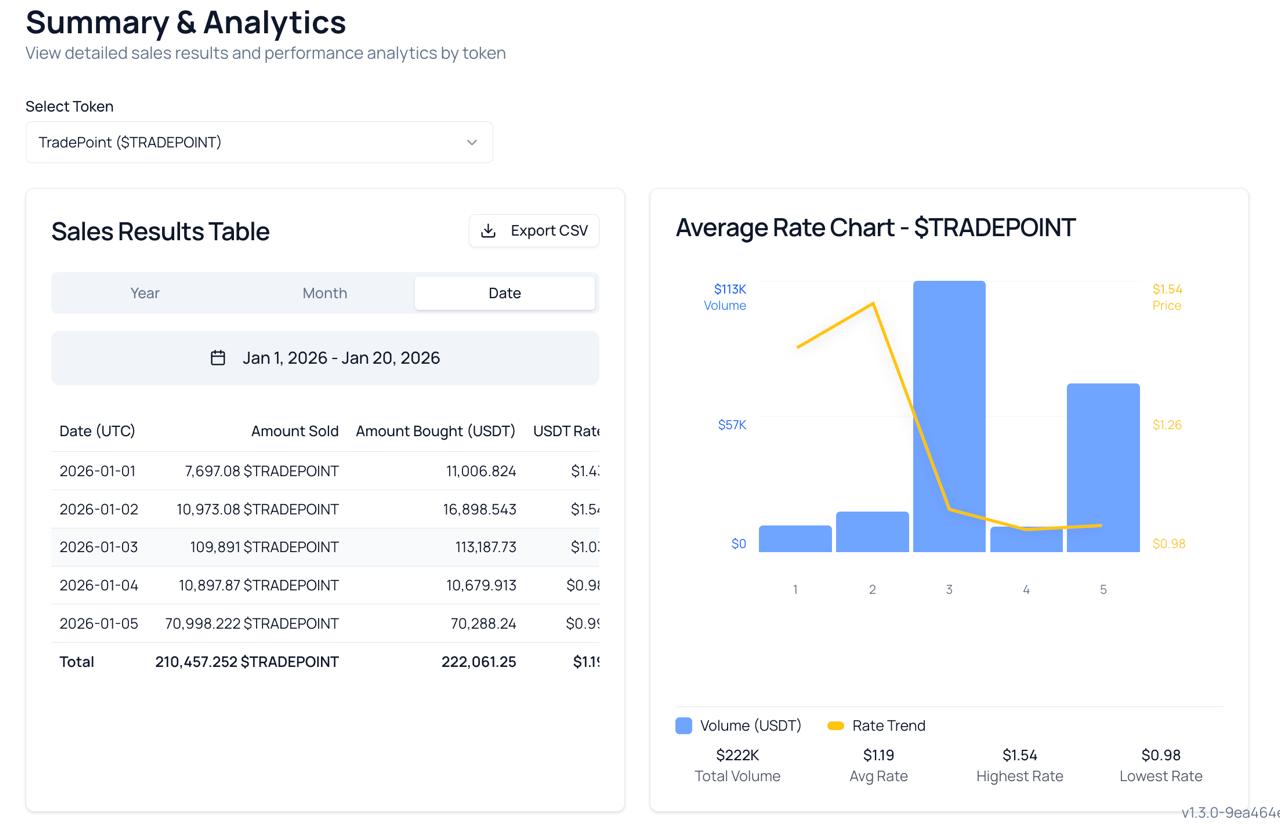
Layout Overview
The Summary page has a two-column layout:
Left Side: Sales Results Table
- Shows detailed sales data in tabular format
- Includes period selector and navigation
- Export CSV button at the top
- Total row at the bottom
Right Side: Average Rate Chart
- Visual representation of USDT rates over time
- Bar chart showing rate trends
- Summary statistics below the chart
- Same period as the table (synchronized)
Both Sides Update Together:
- Selecting a period updates both table and chart
- Navigating to different months/years syncs both
- Changing tokens updates both simultaneously
5. Viewing Sales Results Table
Table Columns
| Column | What It Shows | Example |
|---|---|---|
| Date (UTC) | Date the sale was executed | 2025-03-15 |
| Amount Sold | Quantity of tokens sold | 1,000.00 USDT |
| Amount Bought (USDT) | USDT received from sale | 1,000.00 |
| USDT Rate | Price per token | $1.00 |
Understanding Each Column
Date (UTC)
- Shows when the sale was executed
- Times are in Coordinated Universal Time (UTC)
- Format: YYYY-MM-DD (year-month-day)
Example:
2025-03-15 = March 15, 2025
2025-01-01 = January 1, 2025
Amount Sold
- The quantity of your tokens that were sold
- Shown with token symbol (e.g., “1,000 USDT”)
- Formatted with thousands separators for readability
Example:
1,000 USDT = One thousand USDT sold
50,000 USDT = Fifty thousand USDT sold
Amount Bought (USDT)
- The USDT you received from the sale
- This is your proceeds (what you earned)
- Should match Amount Sold × USDT Rate
Example:
If you sold: 1,000 USDT
At rate: $1.00
Amount Bought: 1,000 USDT
USDT Rate
- The exchange rate for the sale
- Shown in USD currency format
- This is the price per token
Example:
$1.00 = Each token sold for $1.00
$0.99 = Each token sold for $0.99
Example Table
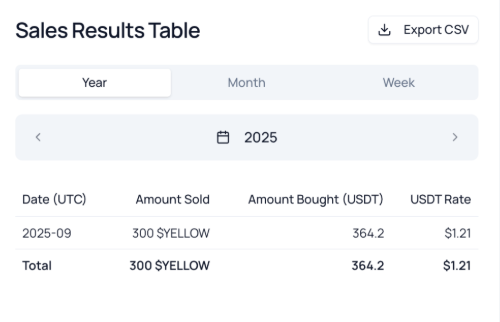
Reading This Table:
- 2025-09**:** Sold 300 $YELLOW at $1.21, received 364.2 USDT
- Total: 300 $YELLOW sold over 1 days, average rate $1.21
Total Row
The last row shows aggregated totals:
Total Amount Sold
- Sum of all tokens sold in the period
- Includes all rows in the table
Total Amount Bought
- Sum of all USDT received
- Your total proceeds for the period
Average USDT Rate
- Mean rate across all sales
- Calculated as: (Sum of all rates) ÷ (Number of sales)
Example Calculation:
Sales:
Day 1: 1,000 USDT at $1.00
Day 2: 1,000 USDT at $0.99
Day 3: 1,000 USDT at $1.01

Totals:
Amount Sold: 3,000 USDT
Amount Bought: 3,000 USDT
Average Rate: ($1.00 + $0.99 + $1.01) ÷ 3 = $1.00
6. Understanding the Rate Chart
Chart Purpose
The Average Rate Chart visualizes your USDT rates over time, making it easy to spot trends, patterns, and anomalies.
Chart Components
Horizontal Axis (X-Axis)
- Shows time periods (dates, months, or years)
- Matches your selected period type
- Left to right = earlier to later
Vertical Axis (Y-Axis)
- Shows USDT rate values
- Displayed in currency format ($)
- Scale adjusts automatically based on data range
Bars
- Each bar represents one period (day, month, or year)
- Height = USDT rate for that period
- Taller bar = higher rate
- Shorter bar = lower rate
Reading the Chart
Visual Example:
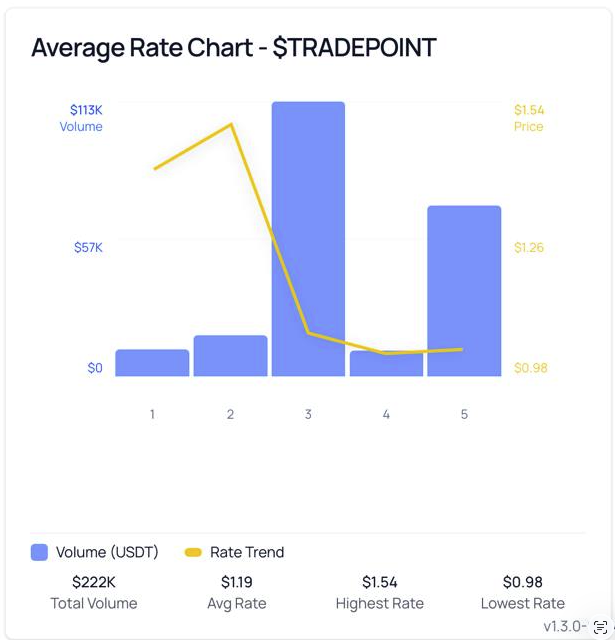
Interpretation:
- Period 1: Highest rate at $1.54 with low volume
- Period 2: Rate began declining, volume remained low
- Period 3: Largest volume ($113K) but rate continued dropping
- Period 4: Lowest rate at $0.98 with minimal volume
- Period 5: Rate recovered to $1.26 with moderate volume
Summary Statistics:
- Total Volume: $222K
- Average Rate: $1.19
- Highest Rate: $1.54 (Period 1)
- Lowest Rate: $0.98 (Period 4)
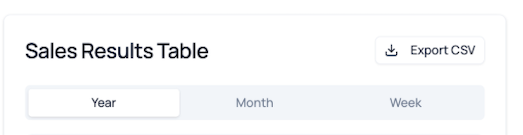
7. Period Selection
The Period Selector allows you to view different time ranges of your sales data.
Period Types
Three Options:
- Year - View annual data
- Month - View monthly data
- Date - View custom date range
8. Exporting Data to CSV
Why Export to CSV?
Common Use Cases:
- External Analysis: Import into Excel, Google Sheets, or data tools
- Record Keeping: Save historical snapshots for your records
- Tax Reporting: Provide data to accountants or tax software
- Custom Visualizations: Create your own charts and reports
- Data Backup: Keep offline copies of your sales data
How to Export
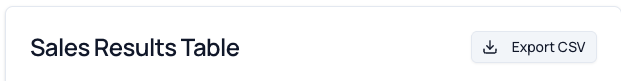
Step 1: Click Export Button
- Locate the “Export CSV” button in the table card header
- Button shows download icon: 📥 Export CSV
Step 2: Select Date Range
A date range picker dialog opens:
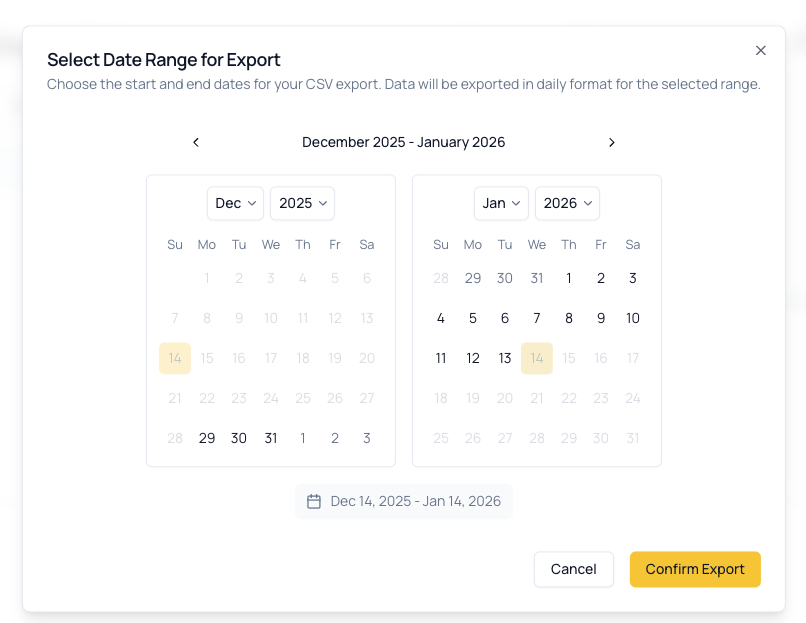
Step 3: Confirm Export
- Select your desired date range
- Click “Export” button
- CSV file downloads automatically
File Name Format:
sales-history-USDT-2025-03-01-2025-03-31.csv
CSV File Contents
Column Headers:
Date,Token,Amount Sold,Amount Bought,USDT Rate
Example Data:
Date,Token,Amount Sold,Amount Bought,USDT Rate
2025-03-01,USDT,1000.00,1000.00,1.00
2025-03-02,USDT,750.00,750.00,1.00
2025-03-03,USDT,1000.00,990.00,0.99
2025-03-04,USDT,1000.00,1010.00,1.01
2025-03-05,USDT,1000.00,1000.00,1.00
What Each Column Contains:
- Date: Sale execution date (YYYY-MM-DD)
- Token: Token symbol (e.g., USDT)
- Amount Sold: Quantity of tokens sold
- Amount Bought: USDT received
- USDT Rate: Exchange rate per token
Opening the CSV File
In Excel:
- Open Excel
- Go to File > Open
- Select your downloaded CSV file
- Data appears in spreadsheet format
In Google Sheets:
- Go to Google Sheets
- Click File > Import
- Upload your CSV file
- Choose import options
- Data appears in the sheet
Tips for Analysis:
- Use SUM function to calculate totals
- Create pivot tables for deeper insights
- Generate your own custom charts
- Filter data by specific criteria
9. Frequently Asked Questions
General Questions
Q: How often is the Summary page updated? A: Data updates automatically after each daily sales execution. Sales typically appear within 1-24 hours after execution.
Q: Can I see real-time sales data? A: No. The Summary shows completed historical sales only. Real-time or pending sales are not displayed.
Q: Why don’t I see any data? A: Common reasons:
- No sales have been executed yet
- Selected token has no sales history
- Selected period has no sales
- Sales configuration was recently created (wait for first execution)
Q: How far back does the data go? A: Data goes back to your first executed sale. There’s no limit on historical data retention.
Q: Can I see other users’ sales data? A: No. You can only see your own sales data. User data is private and protected.
Table Questions
Q: Why do some days show zero sales? A: Possible reasons:
- Sales configuration was stopped
- No available balance
- Sales processing failed for that day
- Weekend/holiday (platform-dependent)
Q: What does NULL or empty mean in the table? A: NULL typically means “no data” or “not applicable” for that field. Empty cells usually indicate zero or no sale occurred.
Q: Can I sort or filter the table? A: The table is pre-sorted by date (chronological order). Use the Period Selector to filter by time range. For advanced filtering, export to CSV and use Excel/Sheets.
Q: Why don’t Amount Sold and Amount Bought always match? A: They can differ slightly due to:
- Exchange rate not exactly $1.00
- Small rounding differences
- Transaction fees (platform-dependent)
Chart Questions
Q: Why doesn’t the chart show all my sales? A: The chart aggregates data based on your selected period type:
- Year view: Shows monthly aggregates
- Month view: Shows daily values
- Date view: Shows daily values within range
Q: What do the different colored bars mean? A: Bar colors typically indicate rate ranges (high/medium/low) or data types. Hover over bars for exact values.
Q: Can I download the chart as an image? A: Not directly from the Summary page. You can take a screenshot or export data to CSV and create charts in Excel/Sheets.
Q: Why is my chart empty but the table has data? A: Try:
- Refreshing the page
- Selecting a different period
- Checking browser console for errors
- Contact support if issue persists
Export Questions
Q: What format is the exported file? A: CSV (Comma-Separated Values), which can be opened in Excel, Google Sheets, and most data tools.
Q: Can I export data for multiple tokens at once? A: No. Exports are per-token. To export multiple tokens, select each token and export separately.
Q: Is there a limit on export size? A: Some platforms may limit exports to 1,000 or 10,000 rows. If you need larger exports, break them into smaller date ranges or contact support.
Q: Can I schedule automatic exports? A: Not currently. Exports are manual. You can export periodically (weekly/monthly) and save the files.
Q: Where does the CSV file download to? A: Your browser’s default download folder (usually “Downloads”). Check your browser’s download settings to change the location.
Period Selection Questions
Q: Why can’t I select future dates? A: The Summary shows historical data only. You can only select dates up to today.
Q: Why are Previous/Next buttons disabled? A: Common reasons:
- No more data in that direction (reached earliest or latest period)
- Currently viewing the most recent period (Next disabled)
- Currently viewing the oldest period (Previous disabled)
Q: Can I see multiple months at once? A: Use Year view to see monthly aggregates across an entire year. For detailed multi-month daily data, export to CSV and analyze externally.
Q: What’s the difference between Month view and Date view? A:
- Month view: Shows one aggregated row per month
- Date view: Shows daily breakdown within a custom range
11. Troubleshooting
Issue: “Loading tokens…” Never Completes
Symptoms:
- Token dropdown shows “Loading tokens…” indefinitely
- Cannot select any token
- Page appears stuck
Solutions:
- Refresh the page:
- Press
F5orCtrl+R(Windows) /Cmd+R(Mac) - Wait 10-15 seconds for data to load
- Press
- Check internet connection:
- Ensure stable connection
- Try loading other pages
- Restart router if necessary
- Clear browser cache:
- Press
Ctrl+Shift+Delete/Cmd+Shift+Delete - Select “Cached images and files”
- Clear and reload page
- Press
- Try different browser:
- Use Chrome, Firefox, Safari, or Edge
- Disable browser extensions temporarily
- Contact support:
- If issue persists after trying above
- Provide browser information and screenshots
Issue: “No token available for summary”
Symptoms:
- Dropdown shows no tokens
- Message: “No token available for summary”
- Cannot view any data
Causes & Solutions:
Cause 1: No Sales History
- You haven’t executed any sales yet
- Solution: Wait for your first sales configuration to execute. Sales data will appear after the first execution.
Cause 2: Sales Too Recent
- Sales executed but data not yet indexed
- Solution: Wait 1-24 hours after first sale for data to appear
Cause 3: System Issue
- Database or API problem
- Solution: Contact support with screenshots and details
Issue: Table Shows “No sales data available”
Symptoms:
- Token is selected
- Table displays “No sales data available for the selected period”
- Chart is also empty
Solutions:
- Change period selection:
- Try different Year/Month/Date range
- Sales may be in a different period
- Verify sales have executed:
- Check your Sales Config page
- Confirm configurations are active
- Review configuration history
- Wait for sales processing:
- If you just activated a config, wait for first execution
- Sales typically process daily after cut-off time
- Check date range:
- Ensure selected range includes actual sale dates
- Use Year or Month view to find periods with data
Issue: Chart Not Displaying
Symptoms:
- Table shows data correctly
- Chart area is empty or shows error
- “No data available” message in chart area
Solutions:
- Verify data exists:
- Check if table has rows
- Chart only shows data that exists in table
- Refresh the page:
- Hard refresh:
Ctrl+F5/Cmd+Shift+R - Clears any rendering issues
- Hard refresh:
- Check browser compatibility:
- Charts require modern browsers
- Update browser to latest version
- Enable JavaScript if disabled
- Zoom level:
- Reset browser zoom to 100%
- Some charts don’t render well at extreme zooms
- Browser console:
- Press
F12to open developer tools - Check Console tab for errors
- Screenshot errors and contact support
- Press
Issue: Export CSV Fails or Downloads Empty File
Symptoms:
- Click Export CSV but nothing happens
- File downloads but is empty or corrupted
- Export button doesn’t respond
Solutions:
- Check browser download settings:
- Ensure downloads are allowed
- Check if pop-ups are blocked
- Allow downloads from TradePoint domain
- Try different date range:
- Select smaller date range
- Large exports may time out
- Break into multiple smaller exports
- Verify data exists:
- Ensure table shows data for your range
- Cannot export empty periods
- Check file after download:
- Open CSV in text editor (Notepad, TextEdit)
- Verify it contains data
- If corrupted, try export again
- Try different browser:
- Download behavior varies by browser
- Chrome, Firefox, or Edge may work better
- Contact support:
- Provide date range attempted
- Screenshot of any errors
- Mention which browser you’re using
Issue: Numbers Don’t Match Between Table and Chart
Symptoms:
- Table shows one value
- Chart displays different value
- Totals don’t align
Common Causes:
Cause 1: Aggregation Differences
- Month view aggregates daily data
- Chart may show monthly averages
- Table shows actual totals
- This is expected behavior
Cause 2: Rounding
- Chart may round for display
- Table shows precise values
- Small differences are normal
Cause 3: Data Loading
- One component loaded before the other
- Solution: Refresh the page to sync
Cause 4: Bug
- Genuine calculation error
- Solution: Screenshot and report to support
Issue: Cannot Select Custom Date Range
Symptoms:
- Date picker doesn’t open
- Cannot click on dates
- Calendar is disabled or greyed out
Solutions:
- Check period type:
- Ensure “Date” tab is selected
- Calendar only available in Date view
- Click calendar icon:
- Click the 📅 calendar icon explicitly
- Don’t just click the date text
- Browser compatibility:
- Date picker requires modern browser
- Update to latest browser version
- Enable JavaScript
- Disable browser extensions:
- Ad blockers may interfere
- Temporarily disable extensions
- Try in incognito/private mode
- Try different browser:
- Date pickers sometimes have browser-specific issues
- Test in Chrome, Firefox, or Safari
Issue: Previous/Next Buttons Don’t Work
Symptoms:
- Click Previous or Next but period doesn’t change
- Buttons appear enabled but do nothing
- Navigation seems broken
Solutions:
- Check if buttons are disabled:
- Disabled buttons appear greyed out
- Cannot navigate beyond available data
- Wait for loading:
- If “Loading…” appears, wait for completion
- Don’t click repeatedly during load
- Refresh the page:
- May be a temporary glitch
- Hard refresh:
Ctrl+F5/Cmd+Shift+R
- Switch period types:
- Try changing from Year to Month or vice versa
- Then switch back
- Contact support:
- If navigation consistently broken
- Provide details about which direction (prev/next) fails
Need More Help?
If you’re still experiencing issues after trying the troubleshooting steps:
- Review related documentation:
- Sales Configuration Guide for setup questions
- Contact support with:
- Clear description of the issue
- Token symbol you’re viewing
- Period type and range selected
- Steps you’ve already tried
- Screenshots showing the problem
- Browser name and version
- Date and time when issue occurred
When Contacting Support About Summary Page, Provide:
- Selected token
- Period type (Year/Month/Date) and specific period
- What you expected to see vs. what you actually see
- Whether table, chart, or both are affected
- Any error messages (exact wording)
- Screenshots with timestamps
Summary Checklist
To effectively use the Summary page:
- Understand historical data - Shows completed sales only
- Know how to select tokens - Use dropdown to switch between tokens
- Know the three period types - Year, Month, Date (custom)
- Understand table columns - Date, Amount Sold, Amount Bought, Rate
- Can read the chart - Visual representation of rates over time
- Know how to navigate periods - Previous/Next buttons and period selector
- Can export to CSV - For external analysis and record keeping
- Understand totals - How aggregates are calculated
- Know timezone - All dates/times in UTC
Quick Reference:
- Purpose: Review historical sales performance
- Data: Executed sales only (not future/pending)
- Periods: Year (annual), Month (monthly), Date (custom daily)
- Export: CSV format for external analysis
- Update: Automatically after daily sales execution
- Privacy: Your data only (no other users visible)
This guide is maintained by the TradePoint team. Last updated: January 2025